Training

Visualise Data with Microsoft Power BI

Empower your data journey with hands-on training in Microsoft Data Analytics and Power BI. Master data analysis and visualisation to make impactful decisions β€” and prepare for the Microsoft PL-300 certification along the way.

Overview

What You'll Learn

An in-depth guide to data analytics and Power BI for data professionals β€” covering data connectivity, transformation, modelling, and visualisation. Build interactive dashboards, learn to leverage Copilot for automation, and get an introduction to Microsoft Fabric for advanced analytics.

Key Features

  • Comprehensive learning modules covering data analysis and Power BI
  • Instructor-led training from a Microsoft-certified expert
  • Core training on data transformation, modelling, and visualisation
  • Well-structured, real-world use cases participants can relate to
  • Hands-on labs in Power BI Desktop to apply concepts practically
  • Problem-based learning using real-world scenarios

Who Should Attend

  • Aspiring data analysts aiming to enhance their data visualisation skills
  • Data professionals seeking to deepen their Power BI expertise
  • Business intelligence specialists needing advanced training in data modelling and analytics

Prerequisites

  • Basic knowledge of Microsoft Data Analytics is recommended
  • Familiarity with Microsoft Excel and basic data analysis concepts
  • Understanding of relational databases is beneficial
  • Knowledge of cloud concepts is advantageous
πŸ“… 14 active teaching days + self-learning modules + assignments
Curriculum

Training Outline

1

Introduction to Power BI / Business Intelligence

  • What Business Intelligence is and why it matters
  • Overview of the Power BI ecosystem (Desktop, Service, Mobile)
  • Role of Power BI in data-driven decision making
2

Identify and Connect to Data

  • Identifying relevant data sources
  • Connecting to common sources (Excel, SQL, Dataverse, cloud services)
  • Basic data import and refresh concepts
3

Introduction to Data Modelling

  • Understanding tables, relationships, and schema design
  • Star schema basics
  • Intro to calculated columns and measures
4

Creating & Designing Dashboards/Reports

  • Choosing the right visual for the data
  • Report layout and design best practice
  • Interactivity: filters, slicers, and drill-throughs
5

Publishing & Sharing Reports in Power BI Service

  • Publishing reports from Desktop to Service
  • Sharing options: workspaces, apps, and permissions
  • Setting up scheduled data refresh
6

Introduction to Microsoft Fabric

  • What Microsoft Fabric is and how it connects to Power BI
  • Overview of key Fabric components (OneLake, Lakehouse, Dataflows)
  • How Fabric fits into the modern BI landscape
See It In Action

Inside the Training

Enrol

Upcoming Cohorts

Live, instructor-led β€” 14 active teaching days + self-learning modules + assignments.

Cohort 1
8–30 October 2026
Β£649

Per person, open enrolment.

Cohort 2
12 November – 4 December 2026
Β£649

Per person, open enrolment.

Testimonials

What Past Participants Say

β€œ
However, my first few days working with Dr. Wilson and the online course opened up an entirely new vista to the use and meaning of data analytics and in particular Power BI. My exposure to data analytics and Power BI was a novel, interesting and eye-opening experience. I end by saying thanks for sharing a little of your vast knowledge, and I would surely take another course where you are the facilitator.
Frank TenchTraining Participant, Nov–Dec 2025 Cohort
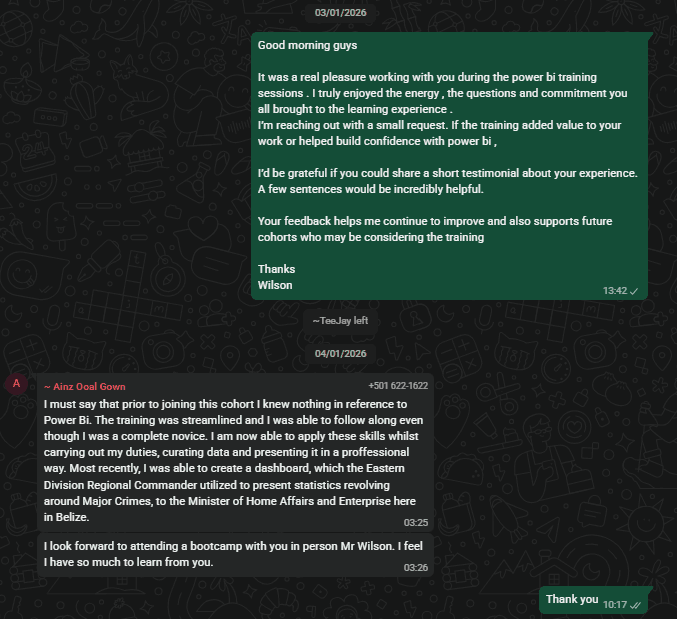
WhatsApp testimonial screenshot
Shared via WhatsAppTraining Participant, Belize
Power BI Training | DataTarget